
AHOY GTS
The Geospatial Engine for Smarter Decisions
AHOY GTS is a powerful geospatial platform designed to help businesses, city planners, and logistics operators make faster, more informed location-based decisions. With dynamic tools that span reachability analysis, live routing, and historical traffic insights, AHOY GTS transforms how movement is understood, managed, and optimized.

Isochrone Tool – Visualize Reach in Real Time
The Live Traffic module provides a constantly updated, interactive map of real-time traffic conditions. But it goes far beyond surface-level visuals, users can drill into individual road segments to access detailed data like current speeds and other traffic metrics. With the Speed Analysis tool, it becomes possible to compare live traffic conditions with historical norms — helping identify unusual congestion, validate trends, and support smarter operational decisions.
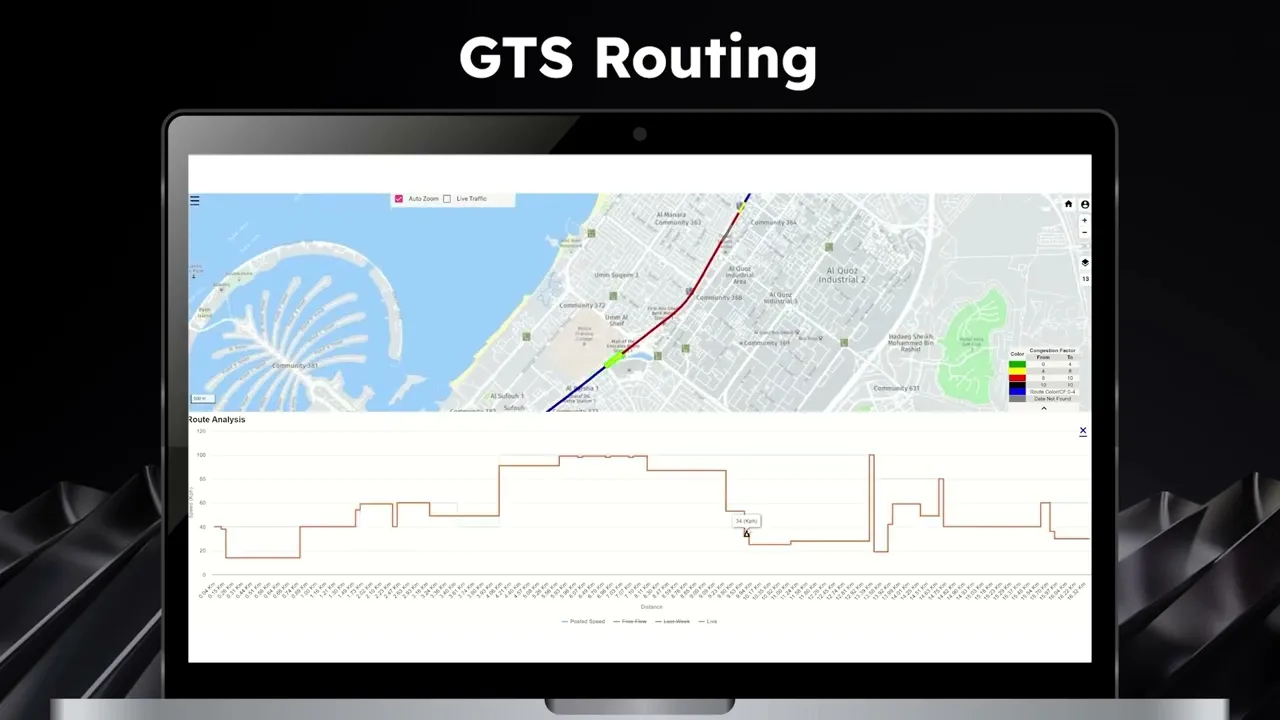
GTS Routing – Smarter, Faster Navigation
GTS Routing uses a sophisticated engine to calculate the most efficient travel routes between any two points — factoring in both live and predictive traffic. Each route displays travel time, distance, and real-time speed indicators along the path. Users can analyze these fluctuations with Route Analysis to find not only the fastest route, but the smoothest and most fuel-efficient. Additional tools like the Typical Travel Time chart reveal recurring traffic patterns by hour and day, enabling precise scheduling and improved punctuality. With route customization tools like "avoid zones" and support for various vehicle profiles, GTS Routing ensures your journey is optimized, compliant, and under control.
Live Traffic – Beyond Colors, Into Insight
The Isochrone tool answers a fundamental question: How far can I go from this point within a given time or distance? By selecting an origin and setting time thresholds (e.g., 10, 20, or 30 minutes), users can instantly generate color-coded polygons that visualize service areas based on real road networks. The tool adapts to departure time, integrating predictive traffic data to show accurate reach during peak and off-peak hours. It also supports multiple transport modes — from cars and buses to trucks and pedestrians — giving planners and operators precise, mode-aware reachability maps for any use case.
Traffic Analytics – Historical Data, Predictive Power
The Traffic Analytics suite allows users to study historical traffic trends with unmatched granularity. Define any corridor, select a timeframe, and visualize how traffic evolved throughout the day using animated playback. Tools like the Travel Time Chart and Congestion Heatmap uncover hidden inefficiencies and routine bottlenecks, while long-term trend analysis helps measure infrastructure improvements or policy changes. The true strength of this module is comparative analysis — enabling users to contrast traffic across different timeframes, weekdays vs. weekends, or pre- and post-intervention periods. This is a vital resource for infrastructure planning, service validation, and strategic decision-making.


